User manual · Agents
The diagnostics dashboard
How error reports from monitored applications become tickets, and how to read the diagnostics dashboard and panel.
This page shows you how to read the diagnostics dashboard and the diagnostics information on a ticket.
The diagnostics module is optional and is turned on by an administrator. If it is off, you will not see a "Diagnostics" entry in the left menu, and none of this applies. Everything below assumes it has been turned on.
What diagnostics tickets are
Some applications your organization runs are set up to report their own errors automatically. TicketMan groups matching error reports together and opens one ticket per group: the first report of a new kind of error creates the ticket, and later reports of the same kind add to its occurrence count rather than creating more tickets.
The dashboard
Select "Diagnostics" in the left menu to open it.
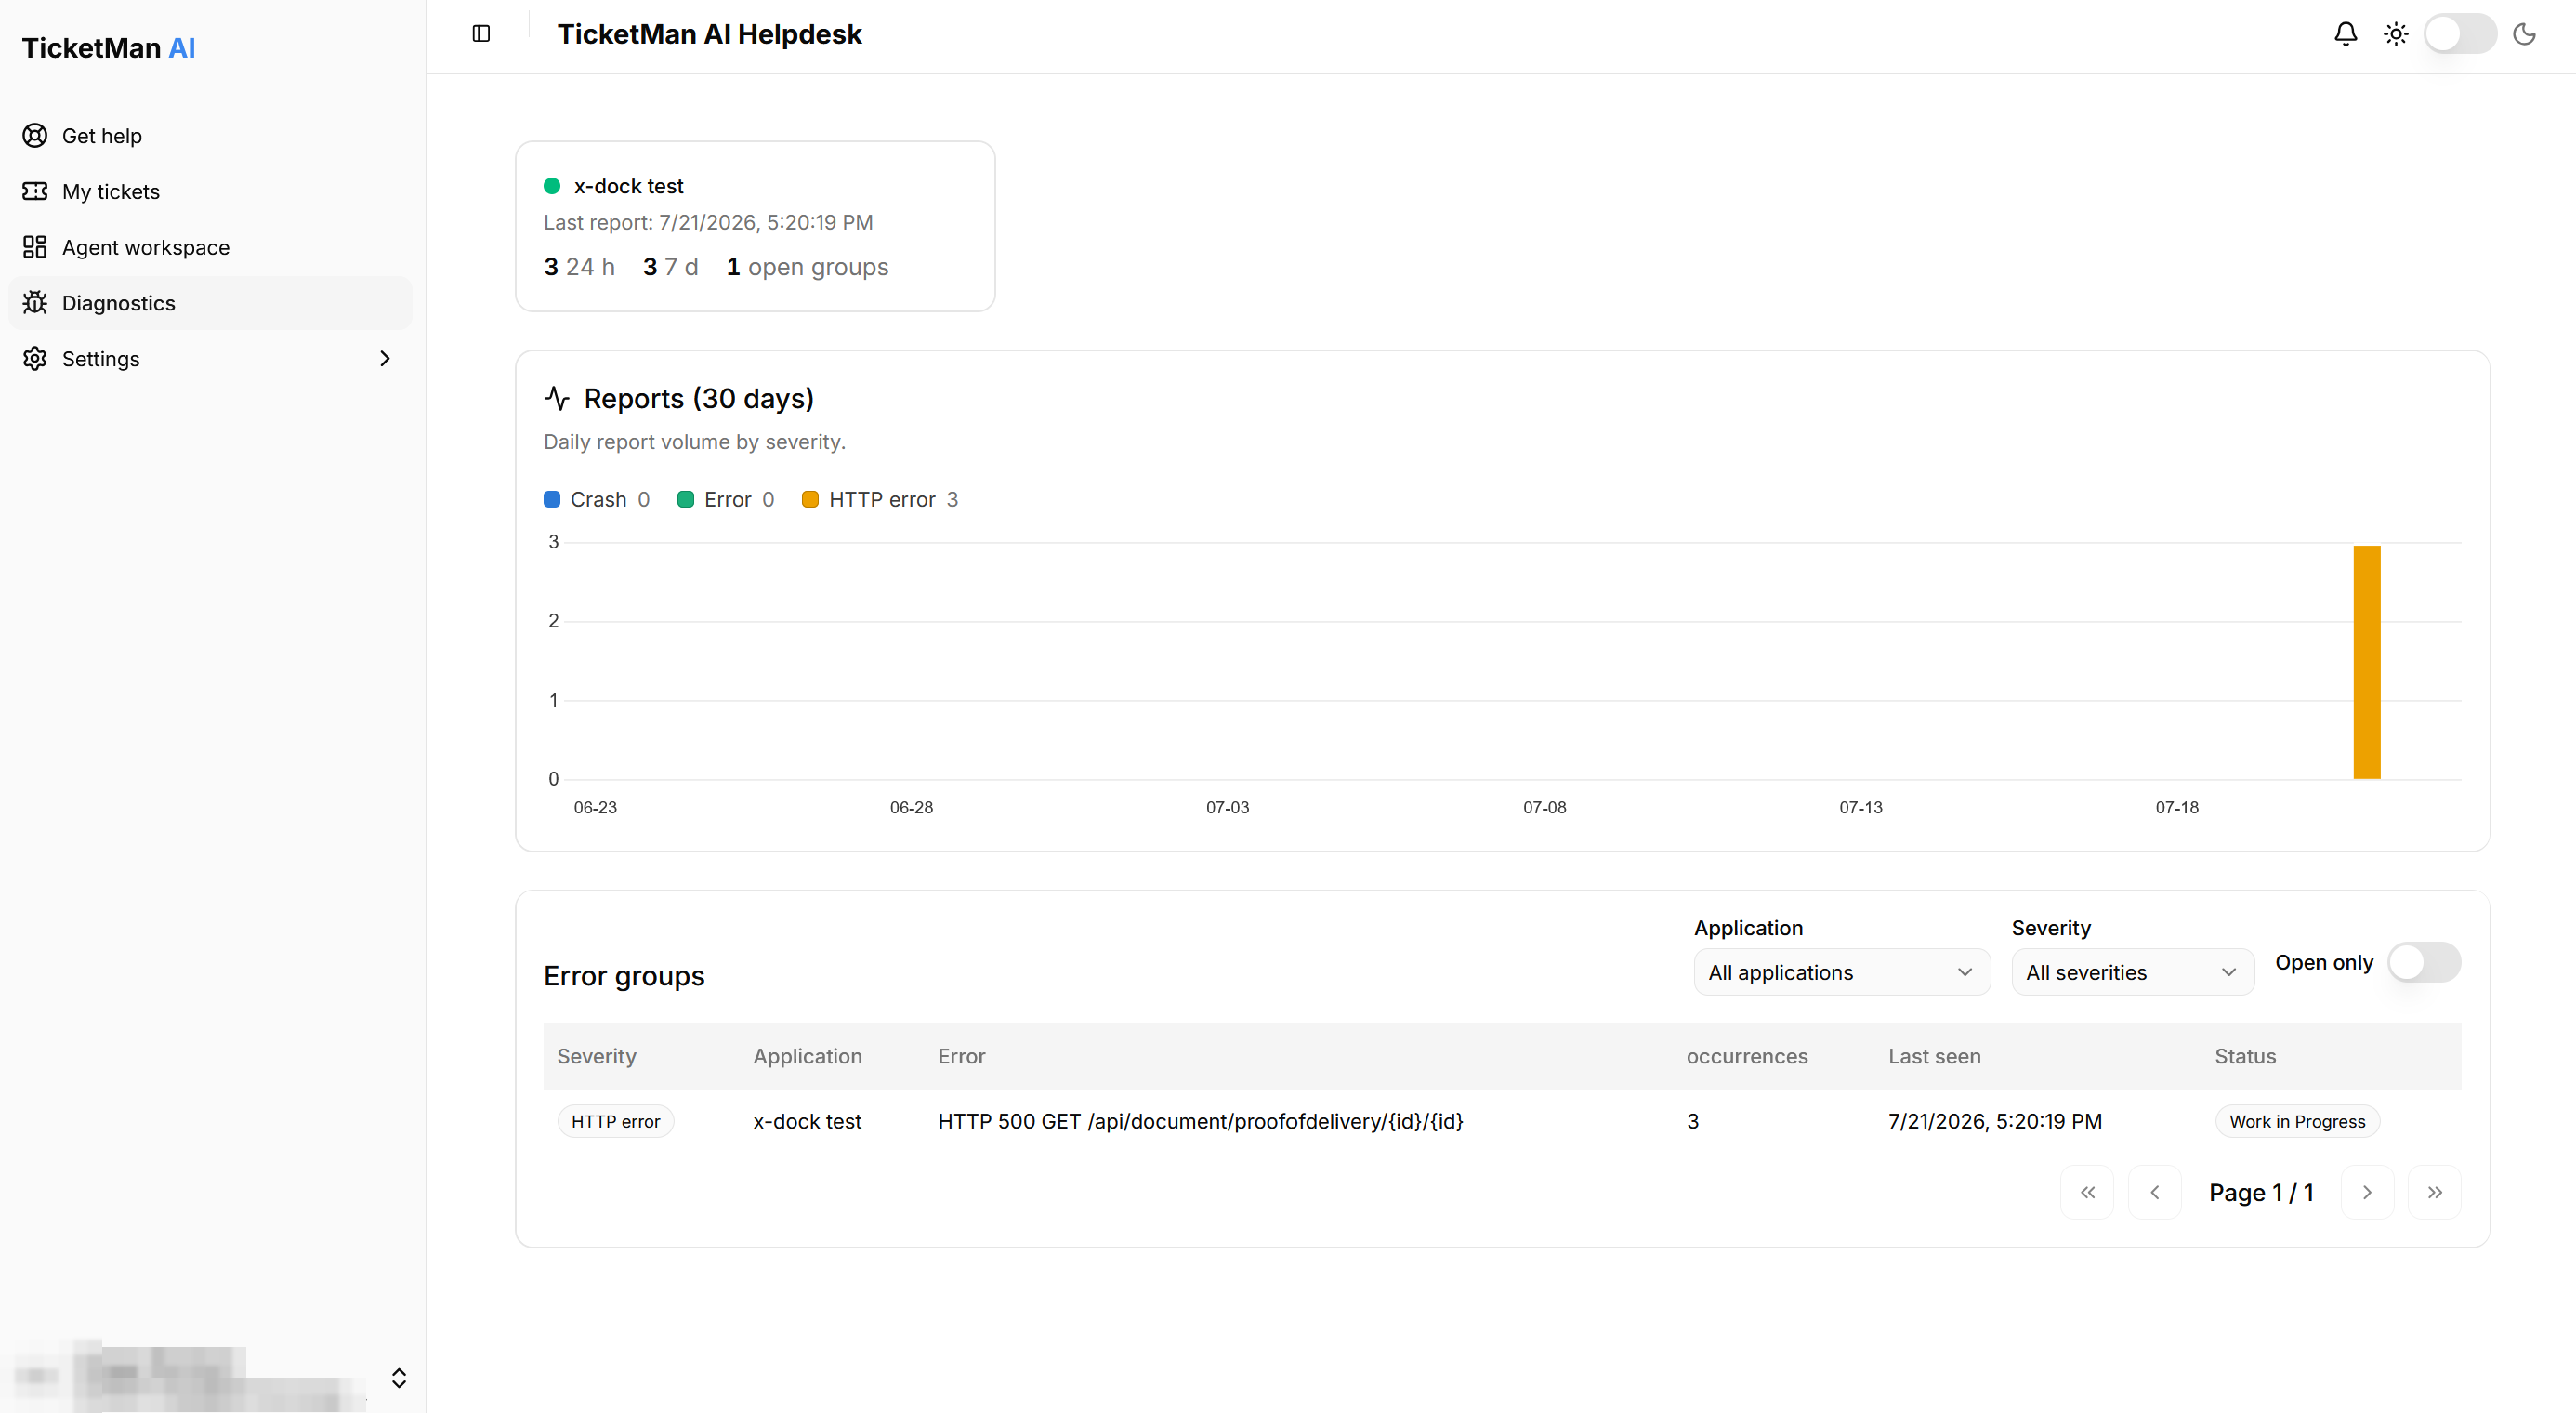
At the top, a card per monitored application shows whether it is active, when it last reported an error, how many reports it has had in the last 24 hours and the last 7 days, and how many error groups are still open.
Below that, a chart shows the daily number of reports over the last 30 days, split by severity: "Crash", "Error", and "HTTP error".
Below the chart is a list of error groups. Each row shows its severity, the application it came from, the error itself (select it to open its ticket), how many times it has occurred, when it was last seen, and the linked ticket's status. Use the "Application" and "Severity" dropdowns, and the "Open only" switch, to narrow the list. A group whose ticket you do not have full access to shows only "Confidential ticket" in place of the error text; see "Confidential tickets" for what that means.
The diagnostics panel on a ticket
A ticket created from an error group carries a diagnostics panel on its page, below the AI assistance panel. It only appears when there is diagnostic data for the ticket and you have full access to it.
Screenshot coming soonThe diagnostics panel on a ticket
The panel shows:
- The error group's severity, the application it came from, how many times it has occurred, and when it was first and last seen.
- A chart of how often it has occurred over time.
- Details of the latest occurrence: the request that failed, if any, the stack trace, environment information, and a log excerpt, each tucked behind its own expandable section.
- Any files attached to the report, with a download button for each.
- An AI root-cause analysis, if one has been generated: what likely caused the error and suggested next steps, with a confidence percentage. Select "Analyze" to request one, or "Re-analyze" to run it again. If AI has not been set up for your organization, this section stays empty and the rest of the ticket works normally without it.